Introduction to Observability
It has 3 pillar we need to know in my knowledge:
- Metrics
- Logs
- Traces
So we will talk about Tracing in this article and it will come with OpenTelemetry(OTel)
What is Open Telemetry (OTel)
It is an observability framework for generating, collecting, and exporting telemetry data such as traces, metrics, and logs. But i will talk only about traces in this article. Metrics and Logs will be introduced in another article with some following information:
- Metrics: Response time, request volume, ingress success rate, status... via Prometheus standard.
- Logs: Application send log to stdout and save those logs for debugging in Elasticsearch, VictoriaLogs with Fluentbit in K8S...
Although OTel supports all of them but i will use only using traces for a demo right now xD
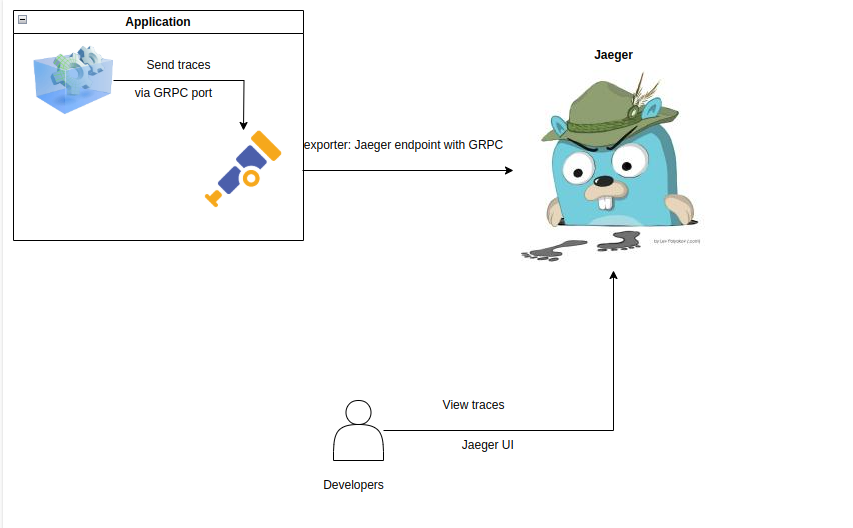
Let's get started with a sample Go project with OTel
Setup quick OTel collector and Jaeger which can be considered as a backend in Localhost
-
Flows:
-
Docker compose script:
services:
  otel-collector:
    image: otel/opentelemetry-collector-contrib:0.120.0
    command: ["--config=/etc/otel-collector-config.yaml"]
    volumes:
      - ./otel-collector-config.yaml:/etc/otel-collector-config.yaml
    ports:
      - "4317:4317"   # OTLP gRPC
      - "4318:4318"   # OTLP HTTP
    networks:
      - otel-network

  jaeger:
    image: jaegertracing/all-in-one:1.66.0
    ports:
      - "16686:16686"   # Jaeger UI
      - "14250:14250"   # Receiver for otel-collector
    environment:
      - COLLECTOR_OTLP_ENABLED=true
    networks:
      - otel-network
networks:
  otel-network:
- Otel config file
otel-collector-config.yaml:
receivers:
  otlp:
    protocols:
      grpc:
        endpoint: 0.0.0.0:4317
      http:
        endpoint: 0.0.0.0:4318

processors:
  batch:
    timeout: 1s
    send_batch_size: 1024
  memory_limiter:
    check_interval: 1s
    limit_mib: 1000

exporters:
  debug:
    verbosity: detailed
  otlp:
    endpoint: jaeger:4317
    tls:
      insecure: true

service:
  pipelines:
    traces:
      receivers: [otlp]
      processors: [memory_limiter, batch]
      exporters: [otlp, debug]
- Docker ps output after
docker compose up
CONTAINER ID   IMAGE                                          COMMAND                  CREATED       STATUS              PORTS                                                                                                                                  NAMES
d0138238848c   jaegertracing/all-in-one:1.66.0                "/go/bin/all-in-one-…"   2 days ago    Up 7 hours          4317-4318/tcp, 9411/tcp, 0.0.0.0:14250->14250/tcp, [::]:14250->14250/tcp, 14268/tcp, 0.0.0.0:16686->16686/tcp, [::]:16686->16686/tcp   opentelemetry-go-app-jaeger-1
3466baff1cb6   otel/opentelemetry-collector-contrib:0.120.0   "/otelcol-contrib --…"   2 days ago    Up 7 hours          0.0.0.0:4317-4318->4317-4318/tcp, [::]:4317-4318->4317-4318/tcp, 55678-55679/tcp                                                       opentelemetry-go-app-otel-collector-1
Setup Application exposes data
I will leave my repo here: https://github.com/BlackMetalz/otel-go-app-sample
- Example when you request to path:
/products. It will connect to DB and some functions which i used to make "accident scenario" - Here is the explanation generated by AI:
When you access the path `/products`, the following flow occurs:

1. **Router Setup**:
   - The `SetupRouter` function configures the Gorilla Mux router to handle the `/products` endpoint with the `GetProductsHandler` function.

2. **Request Handling**:
   - The `GetProductsHandler` function is invoked when a request is made to the `/products` endpoint.

3. **Tracing**:
   - A new trace span is started for the `GetProductsHandler` function using OpenTelemetry.

4. **Request Validation**:
   - The `validateRequest` function is called to simulate a validation step with a 1000ms delay and a 20% chance of failure.
   - If validation fails, an error response is returned, and the trace span is annotated with the error.

5. **Database Query**:
   - The `GetAllProducts` function is called to fetch all products from the database.
   - A new trace span is started for the `GetAllProducts` function.
   - The database query is executed, and the results are scanned into a slice of `Product` structs.
   - If the database query fails, an error response is returned, and the trace span is annotated with the error.

6. **Parallel Slow API Call**:
   - A goroutine is started to call the `HandleSlowAPI` function, which simulates a slow API response with a 1000ms delay.
   - The result of the slow API call is sent to a channel.

7. **Data Processing**:
   - The `processData` function is called to simulate additional processing with a 1500ms delay and a 30% chance of failure.
   - If data processing fails, an error response is returned, and the trace span is annotated with the error.

8. **Wait for Slow API Result**:
   - The handler waits for the result of the slow API call from the channel.

9. **Prepare Response**:
   - A `Response` struct is created to combine the products, slow API status, slow API message, and processing status.
   - The response is encoded as JSON and sent to the client.

10. **End Trace**:
    - The trace span for the `GetProductsHandler` function is ended.

This flow ensures that the `/products` endpoint handles request validation, database querying, slow API calls, and data processing, all while being traced using OpenTelemetry.
- Output example:
{
  "products": [
    {
      "id": 2,
      "name": "table",
      "quantity": 500,
      "price": 100
    },
    {
      "id": 3,
      "name": "wardrobe",
      "quantity": 100,
      "price": 500
    },
    {
      "id": 4,
      "name": "Pens",
      "quantity": 100,
      "price": 10
    }
  ],
  "slow_status": 200,
  "slow_message": "Slow API response at 2025-03-03T09:22:34+07:00\n",
  "process_status": "success"
}
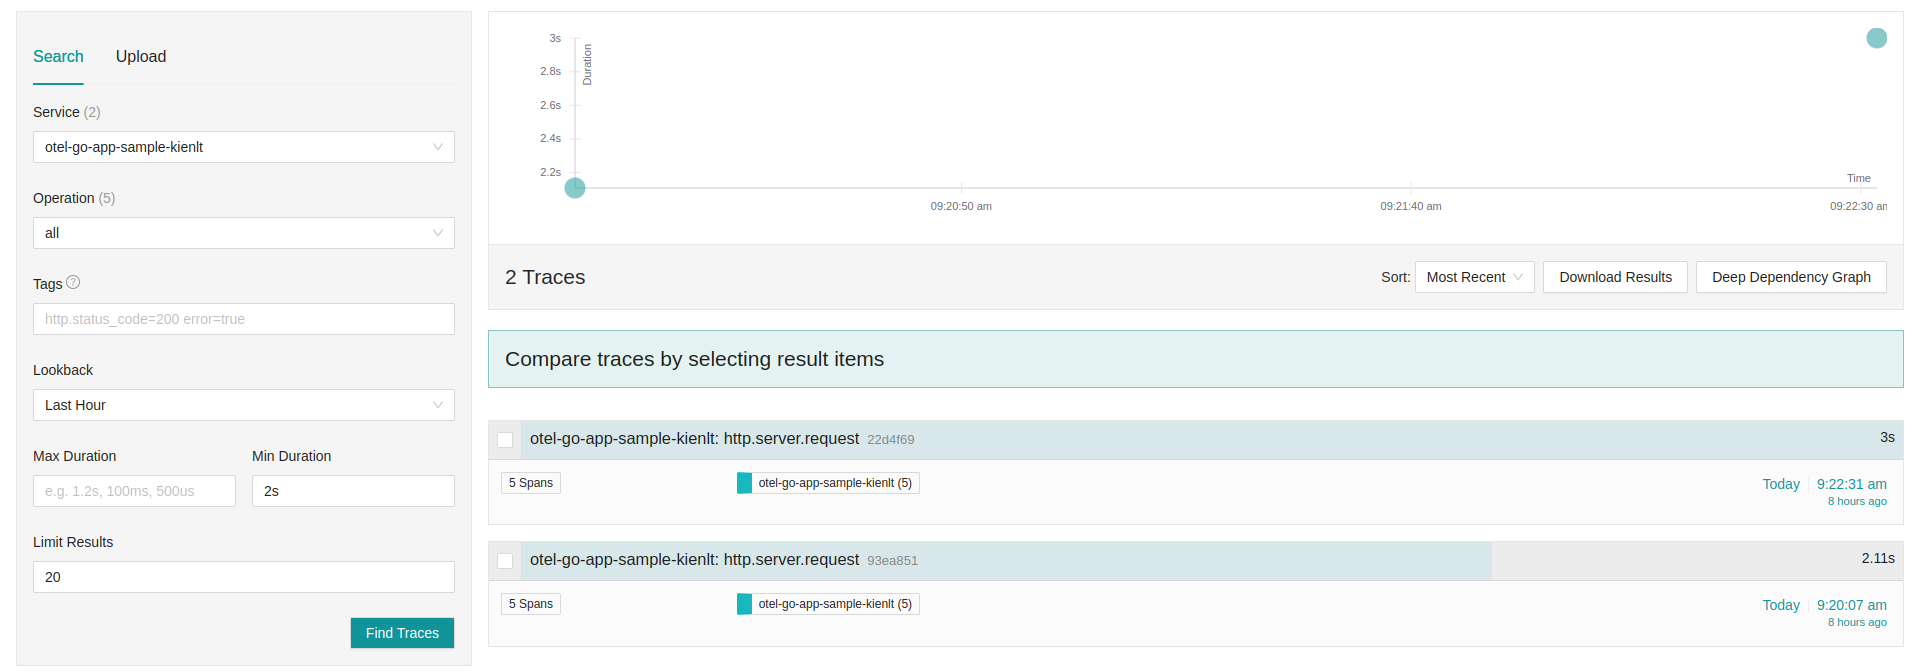
View the traces with Jaeger UI
- Let's take a look at UI to see how many spans and each span take how long for duration. First, i filter for Min Duration as 2 seconds, which means request have more than 2 seconds to respond.
- Then i take a look at the request with 3 seconds duration. You can see clearly each span takes how long to complete the handle
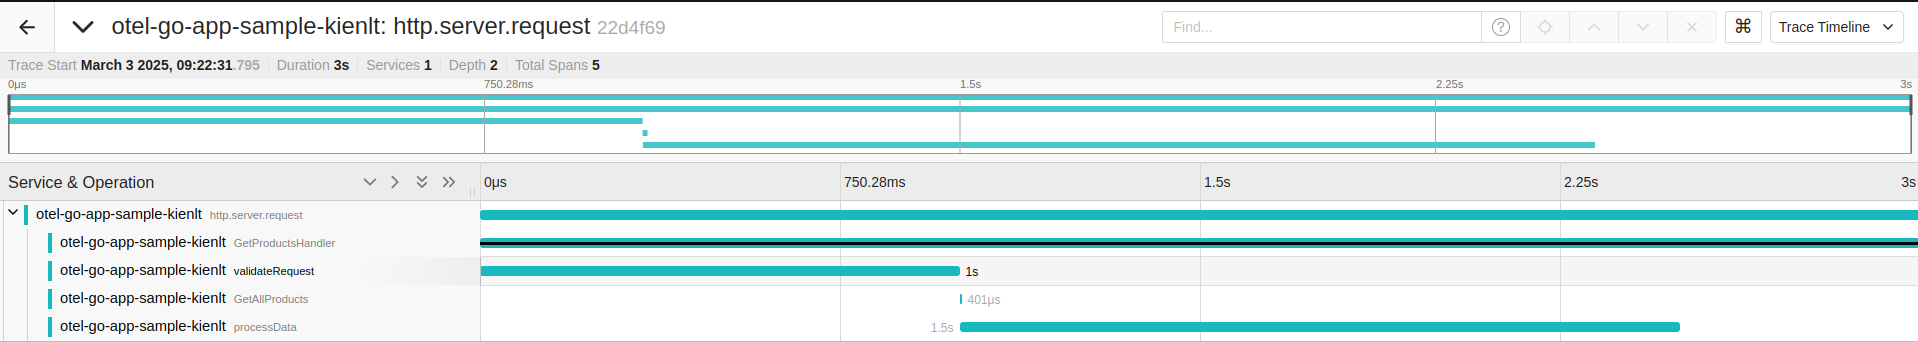
- I will look at span processData
 Source code here: https://github.com/BlackMetalz/otel-go-app-sample/blob/main/utils/mysql.go#L112-L124
// processData simulates additional processing with a delay and possible error
func processData(ctx context.Context, products []Product) (string, error) {
    _, span := otel.Tracer("utils").Start(ctx, "processData")
    defer span.End()

    time.Sleep(1500 * time.Millisecond) // Medium delay
    if rand.Float32() < 0.3 {          // 30% chance of failure
        span.SetAttributes(attribute.String("error", "processing failed"))
        return "failed", fmt.Errorf("data processing failed")
    }
    span.SetAttributes(attribute.Int("processed_count", len(products)))
    return "success", nil
}
That is where 1.5 duration comes from in package utils which is matched with otel.scope.name
Deployment
Assume I'm gonna deploy my application to k8s. And before going into detail, i would tell a real story.
When Open Tracing (https://opentracing.io/ archived!) was introduced by Platform team in my company, the new technology looked promising, many Dev team tried it but gave up due to performance drop hard, which caused everyone left Open Tracing, only Platform team used till today.
So what's wrong?
- First, it comes from bad building architecture. The Platform team gave an endpoint only for Collector, which lead to resource, network bandwidth exhausted if everyone sending together. The result is collector is hang/freeze, no traces metric at all.
- Second, a dev for backend reported that his backend services are only able to handle 20% requests after integrating tracing into his application.
At that time, i know nothing or did not have enough knowledge to understand what is open tracing even i was attempted the agenda of Open Tracing xD. So some fate brings me back to open tracing which is Open Telemtry today after 3 years <3.
What i would change to make OTel use-able?
- Run pod that contain sidecar container, here is example deployment manifest.
# go-app-deployment.yaml
apiVersion: apps/v1
kind: Deployment
metadata:
  name: go-sample-app
  labels:
    app: go-sample-app
spec:
  replicas: 2
  selector:
    matchLabels:
      app: go-sample-app
  template:
    metadata:
      labels:
        app: go-sample-app
    spec:
      containers:
      - name: sample-app
        image: go-sample-app:latest  # Replace with your image
        ports:
        - containerPort: 8080
        env:
        - name: OTEL_COLLECTOR_URL
          value: "localhost:4317"  # Points to the sidecar collector
        resources:
          limits:
            cpu: "0.5"
            memory: "512Mi"
          requests:
            cpu: "0.1"
            memory: "128Mi"
      - name: otel-collector
        image: otel/opentelemetry-collector-contrib:latest
        ports:
        - containerPort: 4317  # OTLP gRPC
        - containerPort: 8888  # Metrics endpoint
        volumeMounts:
        - name: otel-collector-config
          mountPath: /etc/otelcol-contrib/config.yaml
          subPath: config.yaml
        resources:
          limits:
            cpu: "0.5"
            memory: "512Mi"
          requests:
            cpu: "0.1"
            memory: "256Mi"
      volumes:
      - name: otel-collector-config
        configMap:
          name: otel-collector-config
Other notes
Record tracing never been easy on application that have large traffic.
- Google may use 0.01 to 0.1% request for sampling rate?. This is just my guess xD, btw start sampling with rate like 1%!
- Offload Trace Processing to the OTel Collector: This is what i said about deploy OTel collector as sidecar containers
- Minimize Span Attributes and Events: Limit custom attributes to essential data (e.g., user ID, error codes) and avoid logging verbose payloads. Logging only required for tracing, not like show full debug low >.>
- Batch Traces Before Exporting: Sending traces individually increases network I/O. Batching reduces this overhead
- Instrument Only Critical Paths: Only tracing what is important ( API, logic and bottleneck), avoid add trace everywhere!
- Monitor and Tune Overhead: Please monitor CPU/Mem/Network usage of tracing and adjust/tweak sampling/export settings!
Conclusion
- Code/ some context is mostly generated by AI with my promt since I'm not developer, just a system guy want to learn Go xD
- Personally, i don't think OTel is good approach for junior developer, expect use from middle developer!
- Again, i only understand little about tracing, you will not see part Metrics and Logging of OTel in this article.
Ref:
- https://opentelemetry.io/docs/
- https://learn.datadoghq.com/courses/introduction-to-observability
- https://opentelemetry.io/docs/concepts/sampling/
- [https://static.googleusercontent.com/media/research.google.com/en//archive/papers/dapper-2010-1.pdf][https://static.googleusercontent.com/media/research.google.com/en//archive/papers/dapper-2010-1.pdf]