What is VictoriaMetrics(VM)?
- VictoriaMetrics is a free open source time series database (TSDB) and monitoring solution, designed to collect, store and process real-time metrics
- My company used VM to replace Prometheus for high availability and better performance.
- In this article i will introduce 2 type of VM:
- Single node VM: for small business like have lower than 10-20 servers
- Cluster VM: for larger business
Small business with single node VictoriaMetrics
Docker compose
- Yes, using docker compose for the fast deployment and easy to control.
- Docker compose file:
services:
  victoria-metrics:
    image: victoriametrics/victoria-metrics:v1.114.0
    container_name: vm_single_node
    ports:
      - "8428:8428"  # Default port for HTTP API
    volumes:
      - vm_data:/storage  # Save data to a volume
      - ./prometheus.yml:/etc/vm/prometheus.yml  # Mount file config
    command:
      - "-storageDataPath=/storage"  # Specify the path to store data
      - "-retentionPeriod=30d"      # Retain data for 30 days
      - "-promscrape.config=/etc/vm/prometheus.yml"  # Specify the path to the config file
    restart: unless-stopped

volumes:
  vm_data:
global:
  scrape_interval: 60s  # Interval between each scrape
  scrape_timeout: 30s   # Timeout for each scrape

scrape_configs:
  - job_name: 'ES-Dev'
    metrics_path: '/metrics'
    static_configs:
      - targets: ['10.0.0.1:9114']  # target to scrape
- I guess i don't need to write how to start this container!
Insert and test query
- Insert script, run this and wait like 2-3 minutes to fill up metrics
#!/bin/bash

for i in $(seq 1 100); do
  timestamp=$(date +"%Y-%m-%d %H:%M:%S")
  echo "[$timestamp] Inserting metric: kienlt{kien=\"depzai\"} $i into http://localhost:8428/api/v1/import/prometheus"
  curl -d "kienlt{kien=\"depzai\"} $i" http://localhost:8428/api/v1/import/prometheus
  echo "[$timestamp] Sleep for 10 seconds. Insert count: $i"
  sleep 10
done

echo "Completed!"
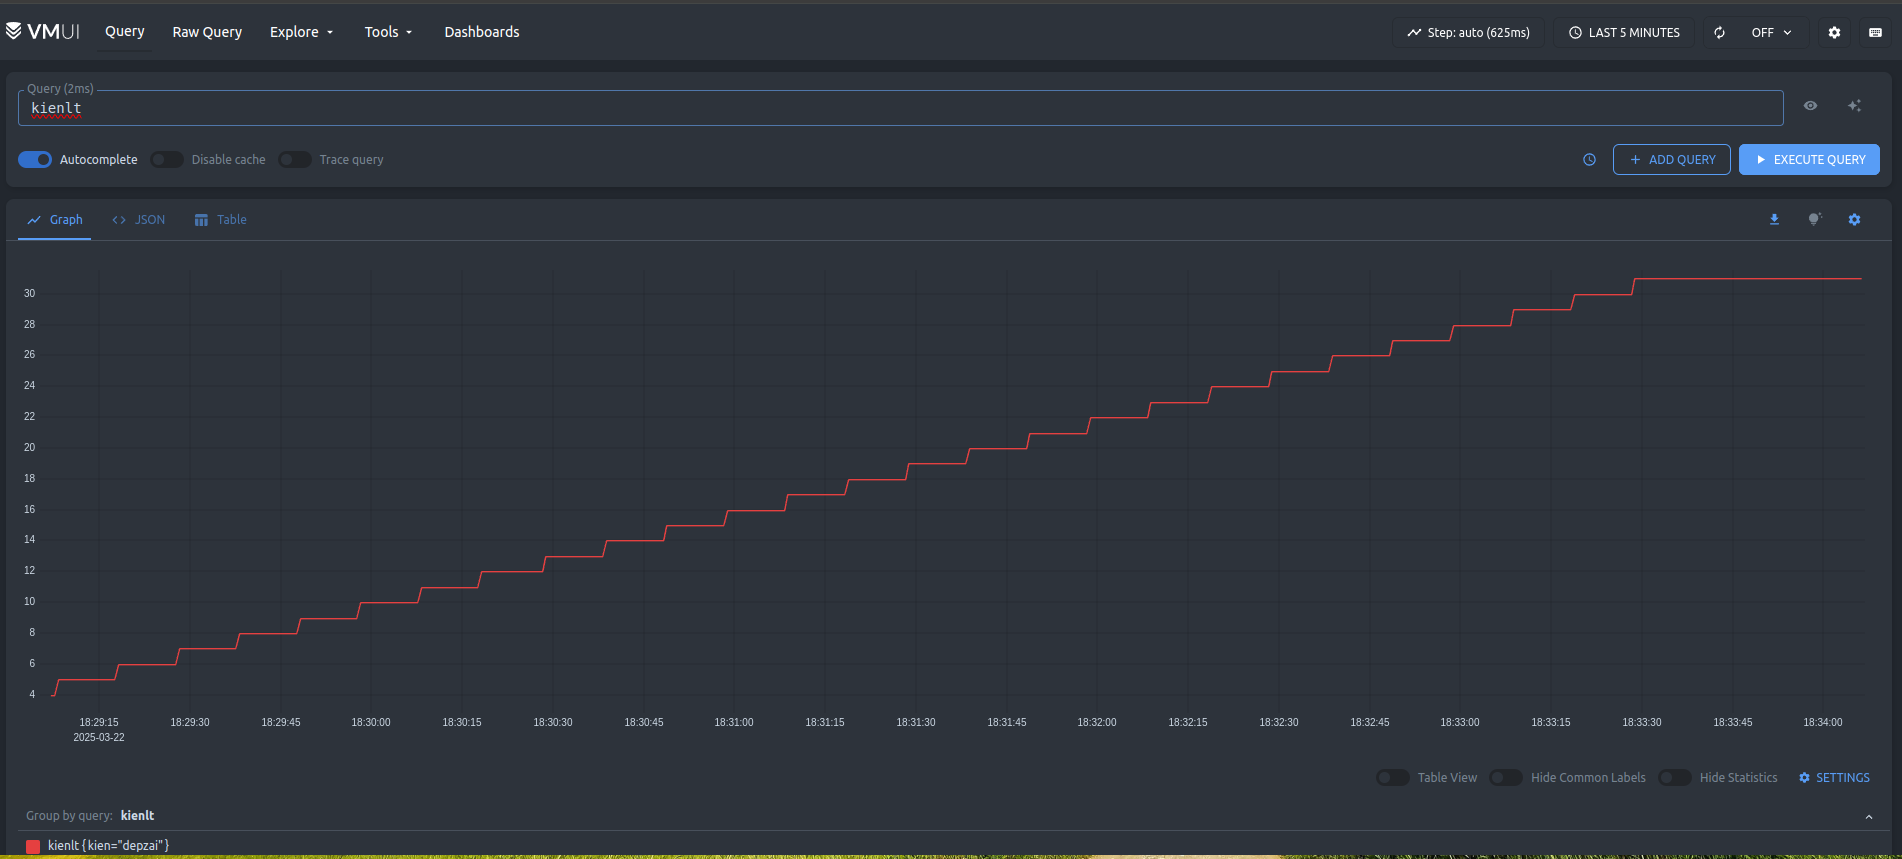
- Query with VM ui at
http://localhost:8428/vmui
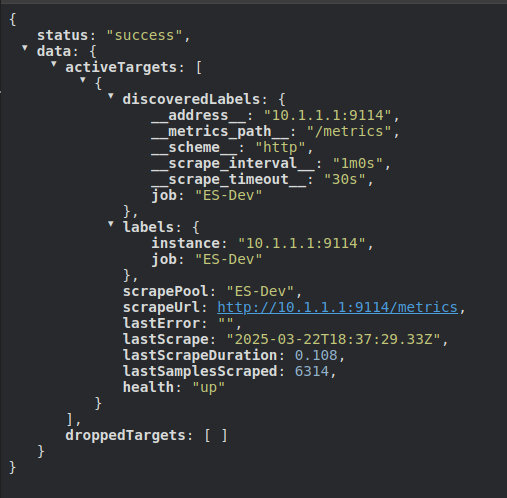
Scrape Target
- We have defined our target need to scrape metric in file
prometheus.yml
- Let's check target at the endpoint: http://localhost:8428/api/v1/targets
Conclusion
- There are many feature of VM but i want to keep this simple and short for single node, since we still have Cluster VM to go.
Ref